
Health Scores: Why Calories Alone Are Lying to You
A 400-calorie meal of grilled salmon, quinoa, and roasted vegetables is not the same as a 400-calorie bag of chips. You know this intuitively. But most nutrition apps treat them identically—just numbers on a dashboard. That's the calorie trap, and it's why so many people eat "within their targets" yet still feel terrible.
The Problem with Calorie-Only Tracking
Calorie counting was a breakthrough when it was introduced. It gave people a simple metric to manage energy balance. But nutrition science has evolved dramatically since then, and we now know that food quality matters as much as food quantity.
Here's what calorie counts miss:
- Processing level: Ultra-processed foods are digested faster, spike blood sugar, and fail to trigger satiety hormones—even at the same calorie count as whole foods.
- Nutrient density: A calorie of spinach delivers vitamins, minerals, and antioxidants. A calorie of soda delivers nothing.
- Inflammatory ingredients: Seed oils, artificial sweeteners, and certain emulsifiers can trigger low-grade inflammation that disrupts metabolism over time.
- Thermic effect: Your body burns more calories digesting protein and whole foods than it does processing refined carbs.
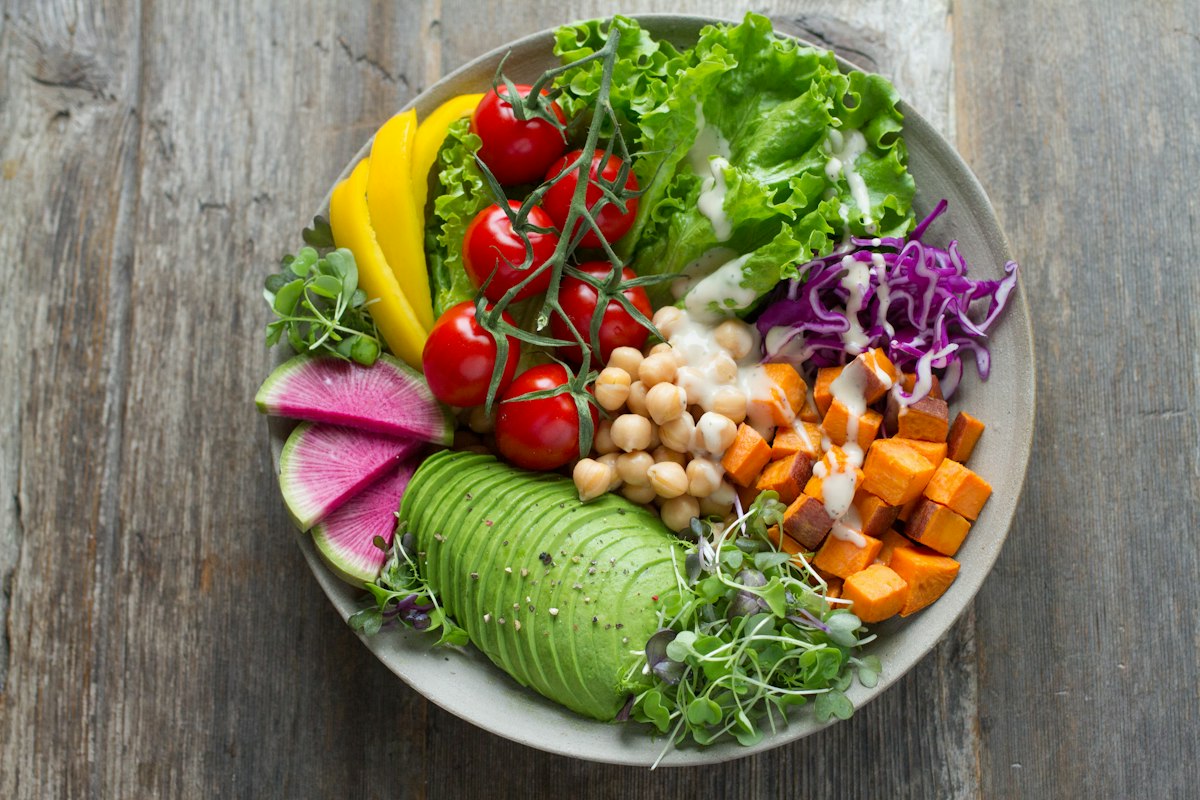
Whole foods score significantly higher than their processed equivalents—even at the same calorie count.
How Health Scores Work
When you snap a photo with Nutrilogix, our AI doesn't just identify calories and macros. It evaluates your meal across three dimensions and generates a single score from 0 to 100:
1. Processing Level (40% of score)
The AI uses visual analysis and food identification to classify each item on the NOVA scale—a widely-used scientific framework that groups foods by processing level. Whole foods (Score: high) like a baked sweet potato score much higher than ultra-processed foods (Score: low) like a frozen TV dinner.
2. Nutrient Density (35% of score)
This measures the vitamins, minerals, fiber, and beneficial compounds per calorie. A meal rich in leafy greens, lean protein, and whole grains will score significantly higher than one composed of empty-calorie refined foods—even if the calorie total is identical.
3. Inflammatory Markers (25% of score)
Our AI flags known inflammatory ingredients—trans fats, excessive added sugars, artificial additives—and adjusts the score accordingly. Chronic low-grade inflammation is linked to heart disease, diabetes, and cognitive decline. This dimension helps you spot hidden culprits you might not realize you're eating.
Real Examples: Same Calories, Different Scores
Let's look at some real comparisons to see the Health Score in action:
Same calorie budget. Wildly different impact on your body. That's the insight Health Scores give you that a calorie counter never will.
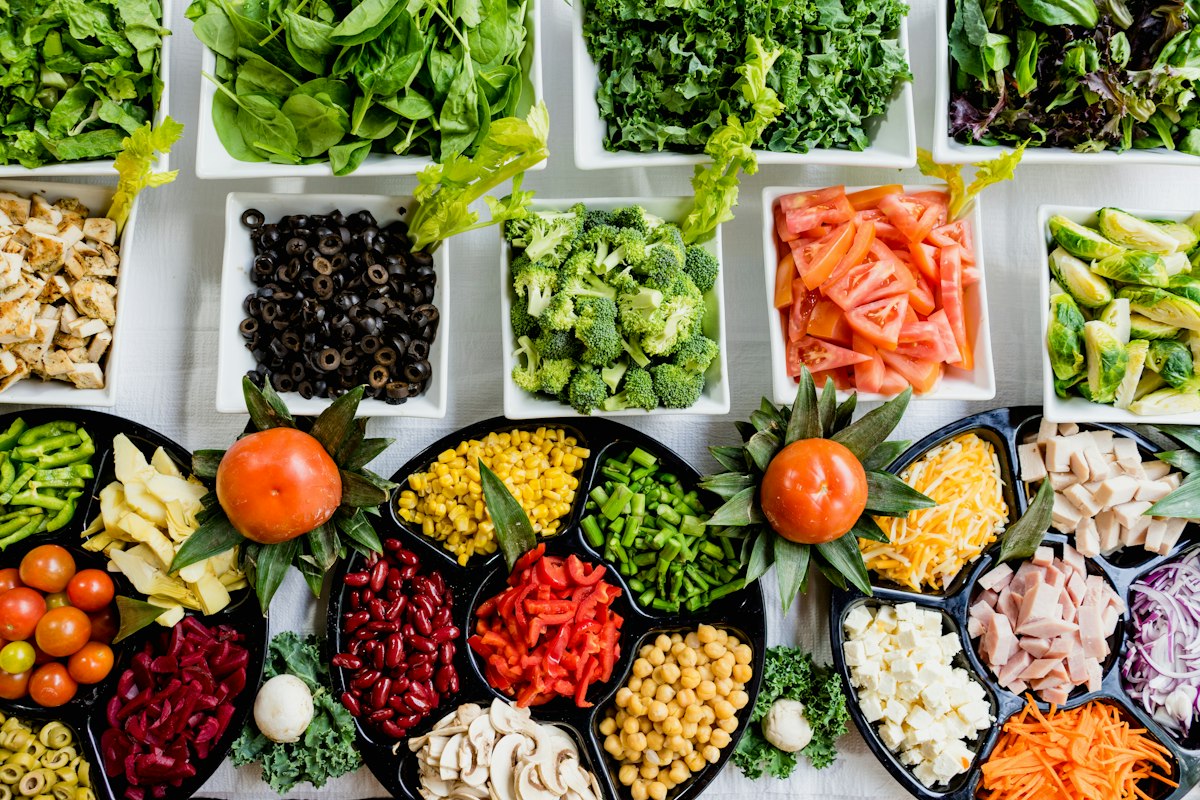
Small swaps toward whole foods compound into dramatic Health Score improvements over time.
Using Health Scores Day-to-Day
Health Scores are designed to be actionable, not judgmental. You don't need to hit 100 on every meal. Here's a practical framework:
- 80-100 (Excellent): Whole, minimally processed foods. Keep doing what you're doing.
- 60-79 (Good): Solid meals with room for a small upgrade. Maybe swap white rice for brown, or add a side of greens.
- 40-59 (Fair): Moderate processing or missing key nutrients. The app will suggest one specific swap to improve.
- Below 40 (Poor): Heavily processed or nutritionally empty. Aim to limit these to occasional indulgences, not daily habits.
Weekly Trends That Matter
Individual meal scores are helpful, but the real power is in the trends. Nutrilogix tracks your 7-day rolling average Health Score and shows you:
- Which days your food quality dips (weekend brunch, anyone?)
- Which meals consistently score lowest (often lunch for busy professionals)
- How your score correlates with your energy levels and mood over time
- Specific ingredient patterns that are dragging your average down
This turns abstract nutrition advice into concrete, personalized data. Instead of "eat healthier," Nutrilogix tells you exactly where to focus for the biggest improvement.
The Bottom Line
Calories tell you how much you're eating. Health Scores tell you how well you're eating. You need both to truly understand your nutrition. With Nutrilogix, you get both in a single photo snap—no manual logging, no guesswork, no judgment. Just clarity.